Microsoft Ships an AL MCP Server. So Why Did I Build My Own?
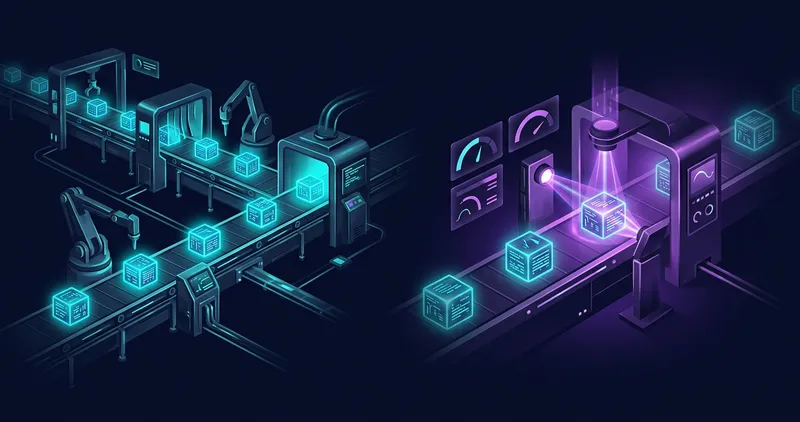
Microsoft added altool launchmcpserver to the AL Language extension. Neat! One config entry and your agent has a Business Central toolbelt.
Which raises a question I have been asked more than once: what is your toolbox Torben? Why add more when Microsoft ships their own?
Short answer: Microsoft tooled the writing half of the development loop, and I’m tooling the verifying half. A bit of a longer answer below, with a feature matrix at the end. Because who doesn’t like a feature matrix. He he
What Microsoft actually ships
“The Microsoft AL MCP” is three separate things, and it matters which one you mean.
First, the AL MCP Server (altool launchmcpserver, the al alias). 15 tools, 9 of them documented on Learn (last I checked), covering the basic development loop: build, compile, publish, symbols, diagnostics, auth. The undocumented six add test runs, symbol relations, page inspection, translations and project management. It keeps one long-lived compilation session, so the compile, fix, recompile cycle is fast.
It’s good at what it does. Credit where credit is due: Microsoft has built a solid AL development toolchain.
Second, the BC Profiling MCP Proxy. A separate 3-tool altool server that schedules profiling, stops it, and fetches the result, forwarding to a profiling MCP hosted inside the running NST. It hands you .alcpuprofile zips.
Third, the Business Central MCP Server (mcp.businesscentral.dynamics.com), the ERP-data surface. Tools are generated from your API pages, writes are admin-gated. Online only, Entra auth, Microsoft-hosted.
And one thing that is not MCP at all: the debugger. al_debug, al_setbreakpoint and al_snapshotdebugging exist, but as VS Code Language Model tools, available only to GitHub Copilot agent mode inside VS Code. Cries in Claude Code. No MCP client outside VS Code can touch them.
That last sentence is the whole blog post, really.
Where my agents kept getting stuck
Here is the road from “I changed this codeunit” to “I know this change is good”, as my agents actually walked it:
- Which tests exist?
al_run_testswants a codeunit ID, and there is no test discovery tool. So my agent greps the workspace for[Test]methods every session, burning context. Or worse, guesses. - Did the tests actually exercise my change? No code coverage. Anywhere. Pass/fail counts and failure text, nothing else.
- Why did that test fail? No debugger over MCP. My agent isn’t Copilot inside VS Code, so it gets a failure string and a shrug.
- Why is it slow? The profiling proxy exists, but it returns a profile blob. Interpreting it was my problem.
- What does this change break?
al_symbolrelationsgives static metadata relations (source tables, interfaces, extensions). No call graph, no “who calls this procedure”, no event fan-out. - Does the app behave correctly for an actual user? The ERP-data MCP is cloud-only and API-page-shaped. No way to drive the real UI (open the page, click the action, answer the dialog) against my on-prem and docker instances.
None of this is a criticism of what Microsoft built. It’s an observation about where they stopped. The al server makes agents productive at producing AL. It gives them almost nothing for verifying it.
My toolbox
So what is in it?
bc-dev-mcp is my answer to the first four bullets above. It talks to the dev endpoint, the same way the AL VS Code extension does.
Test discovery finds test codeunits and [Test] methods straight from source, so my agent never guesses codeunit IDs again. Test runs come back per method, with durations and procedure-level code coverage. Coverage is the line I care about most: it is the difference between “tests passed” and “tests passed and actually touched what I changed”.
Eight debug tools give any MCP client a real debugger: attach, set breakpoints, run tests with breakpoints live, step, read variables, evaluate expressions. No more failure string and a shrug. Profiling captures both sampling and instrumentation runs against the snapshot-debugger port and returns ranked AL hotspots instead of a blob.
Every tool returns structured content validated by a published schema, and the server ships its own operational manual as MCP-served Agent Skills. My agent doesn’t just get tools, it gets told how to drive them.
business-central-mcp is the answer to the last bullet. It speaks the BC web client’s own WebSocket protocol: open pages, read and write data, execute actions, answer dialogs, walk wizards, run reports with PDF capture.
My agents operate the running application the way a user does: real validation, real posting routines, real dialogs. On-prem, docker, for now… This is the “does it actually work for a human” tool.
al-perf is where profiles go to become answers. CLI, web UI, and 12 MCP tools for hotspot analysis, anti-pattern detection, profile comparison, and CI gating on performance regressions. bc-dev-mcp’s profiler hands off to it directly.
al-call-hierarchy is how I answer “what does this change break” before it breaks. An LSP server and static analysis engine built on my own tree-sitter-al grammar: whole-program call graph with cross-app resolution through .app symbol packages, [EventSubscriber]-aware incoming calls.
Its alsem CLI runs 41 BC-specific whole-program detectors (like commit-in-loop, transitive filter loss) and emits SARIF (properly worth a blog post on that alone). It also diffs workspace snapshots for breaking changes across ABI, schema, events and permissions, and gates CI with YAML policies.
bc-mdc-converter came from “I can make this faster and with less noise”. BC’s instrumentation profiler emits an .mdc snapshot zip, and Microsoft’s only converter to a readable profile lives buried inside VS Code, exposed by no CLI.
This Rust binary reproduces Microsoft’s output byte-identically, no .NET required. It adds Firefox Profiler and lossless JSON export formats the official tooling doesn’t have at all. More options for the agent to analyze the profile, who doesn’t like that.
Supporting cast: tree-sitter-al the foundation for everything static, bc-brain (version-pinned BC base-app knowledge with impact, process-flow and integration-point queries for agents), al-differ (structural AL diff) and a custom BC-Bench fork (code not public yet, but it will be) for doing A/B testing on the toolbox.
The goal: “Fix it, prove it, ship it”
Here’s the pattern behind every tool above, and the thing I don’t think Microsoft has fully seen yet. Or maybe had time for yet. Or maybe I missed something, everything goes so fast in this space.
Every AI coding demo has the same shape: the agent writes plausible code, and a human decides whether it’s right. Microsoft’s MCPs automates that. It lets the agent produce more: compile faster, publish faster, even run a test.
But production was never the scarce resource. The scarce resource is knowing whether the code you just ran actually works.
An agent you’d trust with a 2-million-line (guessing 😉) ERP codebase doesn’t need a faster compiler. It needs senses:
- Did it work? Structured test results, per method, with coverage that proves the change was exercised.
- Why not? A debugger it can drive itself: break on the failure, read the variables, step, form a hypothesis, test it. Not a failure string to guess against, but hey, better than nothing.
- What did it cost? Profiles that come back as ranked hotspots and anti-patterns, with CI gates on regressions.
- What will it break? Whole-program call graphs, event fan-out, semantic breaking-change diffs before the change ships.
- Does the business process still run? Drive the real UI end to end: create the order, post it, print the invoice, read the PDF.
- Is any of this helping? BC-Bench benchmarks agents on real AL tasks in real containers, so “the tooling helps” is a measurement, not a vibe.
That was my goal: make a system an agent can not only write code with, but also verify it. End to end.
Plan with bc-brain, change with al, prove with tests, coverage and alsem gates, diagnose with the live debugger, measure with the profiler, operate the app with business-central-mcp. Every step in that loop is a tool an agent can call.
Microsoft is teaching agents to write AL. I’m teaching them to know when they’re wrong. If you’re the one running the resulting code in production, you already know which half was missing.
The promised feature matrix
“Microsoft” counts all three MCP surfaces plus, where noted, VS Code-only features.
| Capability | Microsoft | My toolbox |
|---|---|---|
| Author & build | ||
Compile / build / publish .app | Yes: al_build, al_compile, al_publish | No, deliberately. Use al, it’s good |
| Symbol download, symbol search | Yes: al_downloadsymbols, al_symbolsearch | Roadmap (on-demand source/symbols) |
| Entra ID auth | Yes: al_auth_login | Roadmap (UserPassword today) |
| Test & verify | ||
| Test discovery from source | No, must know codeunit IDs | Yes: bcdev_test_discover |
| Run tests via MCP | Partial: al_run_tests (undocumented; pass/fail plus failure text) | Yes: bcdev_test_run, per-method results, durations, multi-codeunit plans |
| Code coverage | No | Yes, procedure-level, mapped to local source |
| Mutation testing | No | Pre-alpha: LethAL |
| Static whole-program analysis | Partial: compiler CodeCops (per-object) | Yes: alsem, 41 detectors, SARIF, policy gates |
| Breaking-change diff | Partial: AppSourceCop baseline checks | Yes: alsem diff, ABI, schema, events, permissions |
| Debug | ||
| Interactive debugging from any MCP client | No, VS Code Copilot LM tools only | Yes: 8 bcdev_debug_* tools, attach, breakpoints, step, variables, eval |
| Debug a test run (breakpoints during tests) | No | Yes: bcdev_debug_run_tests |
| Profile | ||
| CPU profile capture via MCP | Yes: profiling proxy (sampling, schedule-based) | Yes: bcdev_profile_*, sampling and exact instrumentation |
| Profile to ranked hotspots in the tool response | No, returns the zip | Yes, ranked AL self-time summary |
| Profile analysis: anti-patterns, regressions, CI gates | No | Yes: al-perf (12 MCP tools) plus AL-Flamegraph |
Headless .mdc snapshot conversion | No, locked inside VS Code DLLs | Yes: bc-mdc-converter, byte-identical, plus Firefox and JSON formats |
| Understand the codebase | ||
| Call hierarchy (who calls this?) | No (al_symbolrelations is static metadata only; type hierarchy is LSP, not MCP) | Yes: al-call-hierarchy, cross-app, event-subscriber-aware, sub-ms |
| Event fan-out / transitive chains | No | Yes: alsem events fanout / chains |
| Impact analysis for agents | No | Yes: bc-brain impact, integration_points, process_flow |
| Operate the running app | ||
| Drive the real UI (pages, actions, dialogs, wizards) | No | Yes: business-central-mcp, the web client’s own protocol |
| Run reports, capture PDF | No | Yes: bc_run_report |
| ERP data read/write via API pages | Yes: BC MCP Server, cloud only | Yes: bc_query (OData) plus bc_write_data, on-prem/docker too |
| Meta | ||
| Works against on-prem / docker for everything above | Partial: build/test yes, data cloud-only, debug VS Code-only | Yes, on-prem-first by design |
| Structured output schemas on every tool | Partial | Yes, structuredContent plus published outputSchema throughout |
| Ships its own usage skills to the agent | No | Yes, Agent Skills over MCP resources |